Key Takeaways
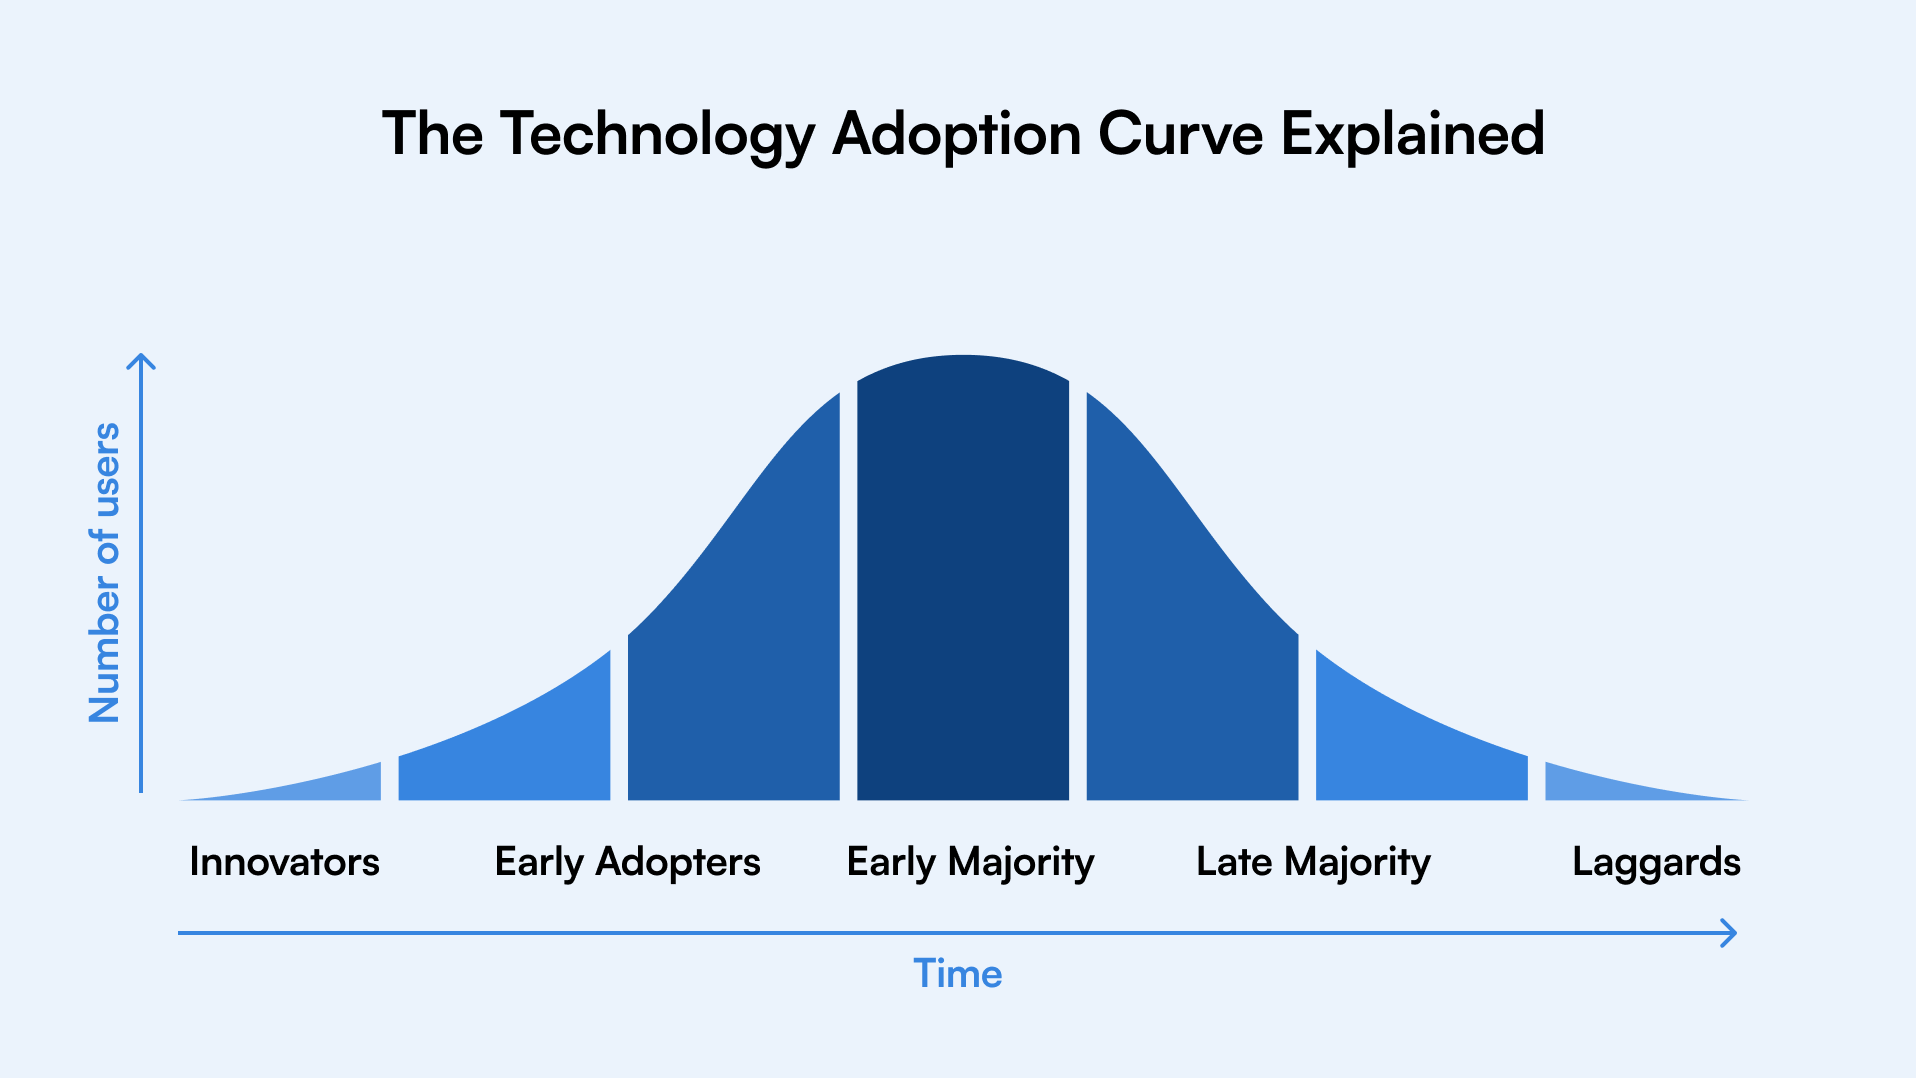
The technology adoption curve illustrates how individuals and organizations adopt new technologies over time, emphasizing that adoption isn't instantaneous and varies significantly among users. This model, developed by Everett Rogers, showcases a bell-shaped curve representing five distinct stages: Innovators, Early Adopters, Early Majority, Late Majority, and Laggards. Understanding these stages enables businesses to tailor their strategies for communication and support, ensuring smoother transitions and increased user engagement. The adoption curve remains crucial for organizations, as it reflects actual user behavior rather than assumptions, thus facilitating better planning and sustained adoption of technologies.
Action Items
- Familiarize yourself with the five stages of the adoption curve to better understand your users.
- Align training and communication strategies with the specific needs of each user group.
- Monitor user behavior to anticipate trends and adjust your approach as needed.
- Implement ongoing support mechanisms to reinforce usage and adaptation over time.
- Consider using tools like ClickLearn to simplify documentation and training processes.
What Is the Adoption Curve?
The technology adoption curve explains how people adopt new technology or products over time. Adoption does not happen evenly or instantly. Some users try new tools early, while others wait until the value feels proven or unavoidable.
For businesses, the adoption curve helps explain why launches succeed or stall. It shows that user behavior follows patterns, not assumptions. When leaders understand these patterns, they can plan training, messaging, and support in a way that matches how people actually change.
Rogersโ Bell Curve Explained
Rogersโ bell curve visualizes how adoption spreads across a population. Instead of a straight line, adoption rises slowly, accelerates as more users join, then tapers off as fewer people remain to adopt.
This model was introduced by Everett Rogers as part of his work on how innovations spread. The bell shape reflects real human behavior. It shows why pushing everyone at once rarely works. For organizations, the curve acts as a planning tool, helping teams time communication, enablement, and change efforts more effectively.
The Five Stages of the Adoption Curve
The adoption curve model breaks user behavior into five clear stages. Each stage reflects how people think, decide, and act when faced with new technology. Understanding these stages helps businesses plan adoption instead of reacting to resistance.
Below is a simple breakdown of how users move across the curve and what that means in real-world adoption.
Innovators
Innovators are the first to try new technology. They are comfortable with risk and enjoy experimenting before systems are fully proven. In businesses, these users often test pilots, early releases, or beta features.
Early Adopters
Early adopters look for value, not novelty. They adopt once they see clear benefits and influence others through feedback and advocacy. Their buy-in often determines whether adoption gains momentum. Geoffrey Mooreโs โCrossing the Chasmโ highlights the critical gap between Early Adopters and the Early Majority.
Early Majority
The early majority waits for proof. They want stability, clear use cases, and guidance. This group represents the tipping point where adoption becomes scalable.
Late Majority
The late majority adopts due to necessity, pressure, or policy. They are cautious and resistant to change. Support, reassurance, and simplicity matter most here.
Laggards
Laggards adopt last or avoid change entirely. They rely on familiar processes and legacy systems. For organizations, this group highlights where enforcement or alternatives may be required.
Technology vs. Product Adoption Curves
Technology and product adoption are often treated as the same, but they follow different patterns. A product is usually adopted once, while technology adoption continues as tools evolve and workflows change. Understanding this difference helps teams plan adoption beyond the launch phase.
The Customer Adoption Lifecycle
The customer adoption lifecycle describes what happens after a user gets access to a new technology. Adoption does not begin at login, and it does not end after first use. It develops over time as users learn, apply, and adjust their behavior.
This lifecycle works alongside the adoption curve. While the adoption curve explains who adopts and when, the customer adoption lifecycle explains how adoption actually sticks.
Most users move through the following stages:
Awareness โ The user understands what the tool is and why it exists
First use โ The user completes basic tasks with guidance
Regular usage โ The user repeats tasks and builds confidence
Reinforcement โ The user adapts to changes, updates, and new features
Each group on the adoption curve moves through these stages at a different pace. When onboarding, training, and support are aligned to each stage, adoption becomes predictable and sustainable instead of reactive.
Adoption Curve Case Studies in Technology and Product Adoption
Understanding the adoption curve model becomes clearer when you see how it plays out in real markets. These real-world examples show how the technology adoption curve works across industries and why user behavior, timing, and readiness shape adoption outcomes.
1. Electric Vehicles and the Technology Adoption Curve
Electric vehicles are a classic example of the adoption curve in action. Early adoption was driven by innovators and early adopters who were willing to pay more for new technology and environmental benefits.
As battery performance improved and charging infrastructure expanded, EVs moved into the early majority phase. Lower costs, better range, and government incentives helped EVs follow the expected path of the innovation adoption curve, pushing them closer to mainstream acceptance.
2. Software Updates and Continuous Technology Adoption
Software updates clearly show how the technology adoption curve differs from one-time product adoption. Companies like Microsoft release regular updates to improve security, performance, and usability.
Innovators and early adopters explore new features first. The early and late majority depend on stability, familiarity, and support. This steady rollout approach keeps adoption moving across the adoption curve and proves that technology adoption is continuous, not a one-time event
3. Streaming Platforms and Product Adoption at Scale
Streaming platforms offer a strong example of product adoption following Rogersโ bell curve. Services like Netflix, Spotify, and Disney+ were initially adopted by users who preferred flexibility and on-demand content.
As internet access improved and content libraries expanded, the early majority joined in today, streaming service.
4. Smart Home Devices and the Adoption Curve Model
Smart home devices like Amazon Echo and Google Home began as novelty products for tech enthusiasts. Early adopters were attracted to automation and voice control.
As setup became simpler and everyday use cases expanded, adoption moved into the early majority stage. These devices now follow a predictable technology adoption curve, reinforcing how the adoption curve applies to both consumer and enterprise technology.
5. Enterprise CRM and ERP Adoption
Large CRM and ERP platforms are a clear example of the technology adoption curve inside organizations. When a new system is rolled out, innovators and early adopters explore advanced features and new workflows early.
The early majority adopts only after structured onboarding and clear role-based guidance are in place. The late majority often struggles with change and falls back on legacy processes unless usage is reinforced. This pattern closely follows the adoption curve model, showing why enterprise adoption depends on continuous enablement, not just system access.
Without ClickLearnโ
- Manual work is time-consuming
- Long learning curve for trainers and authors
- Documentation goes quickly out of date
- Lost or misplaced resources
- Need several tools to create materials
- Resource-heavy on IT and implementation team
With ClickLearn
- Automated creation of documentation
- Quick onboarding for trainers and authors
- Always up-to-date training materials
- Custom eLearning portal
- Record across multiple apps easily
- Resource-light with no server-side implementation
Final Thoughts: Why the Adoption Curve Still Matters
The technology adoption curve remains relevant because user behavior has not changed, even though technology has. Tools evolve fast, but people still adopt at different speeds, with different levels of confidence and resistance. The adoption curve model helps leaders anticipate this reality instead of reacting to it.
For organizations, success depends on supporting users across every stage, not just launching new systems. When adoption is planned with intent, businesses see better usage, faster value, and less friction over time. That is where structured adoption strategies and platforms like ClickLearn play a critical role.
Book a demo to see how you can support users across every stage of the adoption curve and drive sustained technology adoption.
The adoption curve focuses on who adopts and when, based on user behavior and mindset. The stages of technology adoption explain how users progress after adoption begins, from first use to long-term usage. Together, they help businesses plan both rollout timing and ongoing adoption support.
Yes. While commonly used as the technology adoption curve, the adoption curve model applies to any new product, service, or idea. It has been used to explain adoption patterns for consumer products, business services, and even policy changes.
Businesses can anticipate trends by tracking early adopter behavior, monitoring usage data, and gathering continuous feedback. Patterns seen in innovators and early adopters often signal how the broader market will respond as adoption moves across the curve.
Common challenges include crossing the gap between early adopters and the early majority, addressing different user needs at each stage, and maintaining adoption as technology evolves. Many organizations underestimate the effort required after launch.
Digital transformation often fails when user adoption is treated as a one-time event. The technology adoption curve highlights the need for ongoing enablement, reinforcement, and support as users move through different adoption stages over time.
Most users prefer proven solutions over experimentation. They adopt once value is clear, the risk is reduced, and support is available. This is why the middle stages dominate the adoption curve model and determine overall adoption success.
The adoption curve explains adoption timing across user groups. The customer adoption lifecycle explains what users experience after adoption begins, including onboarding, regular usage, and reinforcement. Both models work together to drive sustained adoption.
Yes. Clear communication, role-based training, in-app guidance, and continuous support can help users move faster across the adoption curve. Adoption improves when behavior is supported, not forced.